Convert PDF Data to EXCEL Spreadsheets With The World's Most Powerful Converters - Free, Home, Business & Enterprise!
Eliminate human error
Up to 1000 pages/minute
Convert in over 130 languages
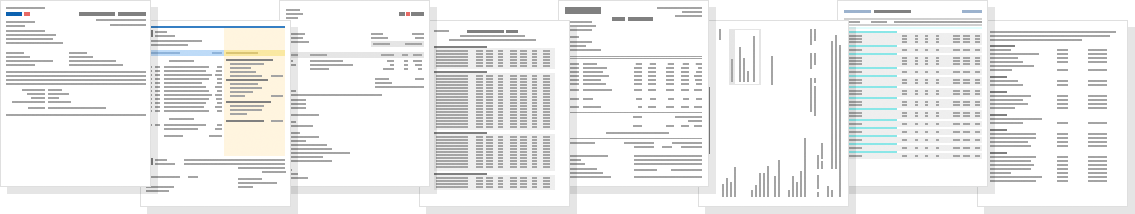
Convert tables, forms, invoices and more.
Eliminate human error
Up to 1000 pages/minute
Convert in over 130 languages
Convert tables, forms, invoices and more.
Choose one of our plans to take advantage of some of our great features, such as …

Create rows from text or lines, Suggested templates, Transpose columns/rows...

OCR, Multiple languages, OCR whole page or sections, Column format...

Highlight tables, Create format types, Append tables / split tables / exclude...

Batch, Command Line interface, server deployment...
Purchase Orders, Invoices, Financials, Bank Statements, Vendor Lists, Bills of Materials, Price Lists, Inventory Lists


One-Time Only Offer: Save hundreds of dollars on our powerful, flexible conversion software by purchasing an annual plan.
Or EMAIL HERE for a custom plan/project!
One-Time Only Offer: Save hundreds of dollars on our powerful, flexible conversion software by purchasing an annual plan.
Or EMAIL HERE for a custom plan/project!